FRI, NOV 7, 2025
On the Second Week
Following last week’s exploration of translating photographic metadata into emotions,this week I continued to refine the method and visualize my findings.
I created a clearer data table that organizes each photograph’s metadata —
including ISO, shutter speed, aperture, and time of capture.
Rather than simply assigning emotions,I focused on how these numbers reveal patterns of behavior and perception.
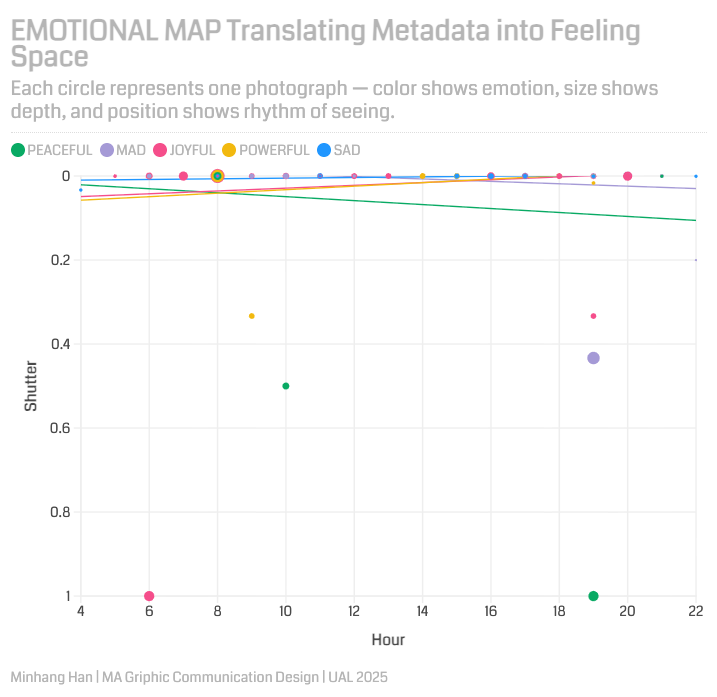
Through visualization, I translated these technical parameters into a map of feelings.Each circle represents one photograph:its color shows emotion, size shows depth, and position shows the rhythm of seeing.
This emotional map suggests that data can also describe a person —their sensitivity to light, their rhythm of attention,and even their emotional tendencies when observing the world.

By analyzing my own data, I discovered that:
- ISO: 80% of photos are above 1000 — I prefer low light, quiet environments.
- Shutter Speed: mostly below 1/60 — I’m drawn to slower, softer movements.
- Time: concentrated between 5–7 p.m. — I tend to be more emotional at dusk.
- Aperture: around f/2.8 — I like intimate, shallow focus.
Instead of reading emotions from visible images,I began to understand the personality behind the process of taking them.
This, to me, is the essence of translation —transforming invisible data into emotional understanding.
Reflection
Through this process, I realized that translation is not about substituting words,
but about revealing relationships —between data and emotion, between self and behavior, between numbers and perception.
Comments