Category: unit1

  • Unit 1: Methods of Contextualising/ Written ResponseⅤ

    Fri, Feb 27,2026

    PART 1 — STATEMENT

    Through developing 909: Garbage Day, I began to reconsider my role as a graphic communication designer in relation to climate justice and UAL’s Net Zero plan. Initially, I approached waste as a problem of awareness, assuming that clearer information would lead to behavioural change. However, working with institutional data revealed that waste is not a singular issue but a systemic accumulation of everyday decisions embedded within structures of production, consumption and disposal.

    Engaging with Latour’s concept of visualisation and Meadows’ systems thinking shifted my understanding. I began to see 909 tonnes not as a neutral statistic but as a constructed artefact — a stabilised representation of complex institutional networks. This reframed my position from message-maker to mediator. Rather than designing persuasive graphics, I focused on designing structures that allow students to navigate, assemble and question waste systems themselves.

    In the context of climate justice, this project has shaped my practice toward translation and contextualisation. I now understand graphic communication not as advocacy alone, but as the creation of discursive and participatory conditions that make systemic relations visible and open to intervention.

    PART 2 — ANNOTATED BIBLIOGRAPHY

    1.Latour, B. (1986)

    ‘Visualisation and Cognition: Drawing Things Together’, Knowledge and Society, 6, pp. 1–40.

    Latour’s argument that visual inscriptions stabilise complex networks profoundly shaped my understanding of 909 as more than a numerical fact. He suggests that diagrams and visual systems do not merely represent reality but actively construct and organise knowledge. In the context of our project, this reframes institutional waste data as a product of classification, measurement and infrastructural mediation. The installation and website function as new inscriptions that reorganise waste into relational stages. Latour helped me recognise that contextualising waste is not about presenting information more clearly, but about reshaping how institutional systems are rendered legible. This shifted my role from designer of outputs to designer of epistemic structures.

    2.Blauvelt, A. (1994)

    ‘An Opening: Graphic Design’s Discursive Spaces’, Visible Language, 28(3), pp. 205–217.

    Blauvelt describes a shift in graphic design from message transmission to the construction of discursive spaces. This was central in repositioning our workshop as a framework rather than a campaign. Instead of persuading students about waste reduction, the project constructs a space in which waste relations can be assembled and questioned. Blauvelt’s writing helped me move beyond an awareness model toward a structural model of engagement. The project therefore operates not as communication but as mediation — enabling meaning to emerge through participation. This was particularly relevant in thinking about climate justice as a shared discursive process rather than a top-down instruction.

    3.Kolb, D. A. (1984)

    Experiential Learning: Experience as the Source of Learning and Development. Englewood Cliffs, NJ: Prentice-Hall.

    Kolb’s experiential learning model informed the participatory dimension of the workshop. His emphasis on learning through cycles of action and reflection supported the decision to translate waste data into embodied interaction rather than static information. In relation to UAL’s Net Zero ambitions, this approach acknowledges that behavioural change requires experiential engagement. Kolb challenged me to consider how design can structure situations in which knowledge is actively constructed. The workshop therefore became a site for experimentation rather than instruction, aligning climate awareness with participatory learning.

    4.Meadows, D. H. (2008)

    Thinking in Systems: A Primer. White River Junction, VT: Chelsea Green Publishing.

    Meadows’ systems thinking provided a framework for understanding 909 tonnes as the cumulative outcome of interconnected processes. Her discussion of feedback loops and leverage points reframed waste from an isolated issue to a systemic phenomenon. This perspective strengthened the conceptual link between individual studio behaviours and institutional totals. In contextualising climate justice within UAL, Meadows’ work emphasised that meaningful intervention occurs within systems rather than at the level of isolated acts. The project therefore attempts to visualise relational dynamics rather than singular statistics.

    5.Forensic Architecture (2010– )

    Research agency based at Goldsmiths, University of London.

    Forensic Architecture’s investigative visual practices demonstrate how spatial and visual reconstruction can expose hidden infrastructures. Their work influenced my understanding of installation as analytical structure rather than aesthetic display. Like their projects, our installation makes invisible systems visible through spatial translation. Although operating at a different scale, the methodological parallel lies in reconstructing complex networks to enable critical reading. This informed the way waste categories were organised as interdependent rather than separate entities.

    6.The Climate Museum (2018– )

    New York.

    The Climate Museum provided a precedent for addressing climate issues through public exhibition and accessible interpretation. However, engaging with their model also revealed limitations of awareness-led approaches. While exhibitions can generate attention, they risk remaining informational rather than structural. This comparison sharpened my own critical stance, pushing the project beyond awareness toward participatory contextualisation. The museum thus functioned both as inspiration and as a point of differentiation, clarifying my position as a designer concerned with mediation rather than messaging.

    Reference List:

    Blauvelt, A. (1994) ‘An Opening: Graphic Design’s Discursive Spaces’, Visible Language, 28(3), pp. 205–217.

    ForensicArchitecture(2010–)ForensicArchitecture.Availableat: https://forensic-architecture.org (Accessed: 27 Feb 2026).

    Kolb, D. A. (1984) Experiential Learning: Experience as the Source of Learning and Development. Englewood Cliffs, NJ: Prentice-Hall.

    Latour, B. (1986) ‘Visualisation and Cognition: Drawing Things Together’, Knowledge and Society, 6, pp. 1–40.

    Meadows, D. H. (2008) Thinking in Systems: A Primer. White River Junction, VT: Chelsea Green Publishing.

    The Climate Museum (2018– ) The Climate Museum. Available at: https://climatemuseum.org (Accessed: 27 Feb 2026).
  • Unit 1: Methods of Contextualising/ week 004

    Fri, Feb 27,2026

    In the final presentation, the project was articulated as a system of translation across mediums: institutional data → website → workshop → installation. This framing helped me clarify my position.

    I realised that the project was not an awareness campaign but an experiment in contextualisation. By treating 909 as an artefact rather than a fact, we reframed climate justice as structural rather than individual.

    The installation became less about representation and more about mediation. It visualised relations rather than outcomes. This week consolidated my understanding of graphic communication as the construction of epistemic structures.

  • Unit 1: Methods of Contextualising/ week 003

    Fri, Feb 20,2026

    The mid-progress presentation exposed both strengths and weaknesses in our approach. Tutors questioned whether students would feel compelled to participate. This pushed me to reconsider the difference between visibility and engagement.

    Feedback suggested refining the workshop framework and clarifying its purpose. I began reflecting on experiential learning and participatory structures. Instead of assuming interaction equals engagement, I started to question what kind of structure enables meaningful participation.

    This week marked a shift from conceptual ambition to structural refinement. The project moved from idea to framework.

  • Unit 1: Methods of Contextualising/ week 002

    Wed, Feb 11,2026

    During the de-brief, our group clarified our direction and began to frame 909 tonnes of waste as a central artefact. This was the moment when the number shifted from being data to becoming a conceptual anchor. Rather than treating it as a statistic to visualise, we began to question how it was constructed and what it concealed.

    We discussed waste categories, flows, and institutional measurement. I became increasingly aware that numbers stabilise complexity. This led to early sketches of structuring waste into stages—awareness, use, treatment, and outcome. The idea was not to simplify waste but to reveal its relational architecture.

    At this point, my role started shifting toward thinking about physical structure and interaction. I was less interested in designing a poster and more interested in designing a system students could move through.

  • Unit 1: Methods of Contextualising/ week 001

    Fri, Feb 6, 2026

    This week marked the beginning of the Methods of Contextualising brief. The introduction to UAL’s Net Zero and Sustainability Implementation Plan immediately positioned the project within an institutional and political framework. Rather than approaching climate justice as an abstract global issue, I began to see it as something embedded within the university’s own infrastructure.

    The Climate Literacy workshop was particularly significant. It shifted my understanding of waste from a moral issue to a systemic one. Instead of asking “How can we reduce waste?”, I started asking “How is waste structured?” This reframing became foundational to our later decision to focus on institutional data rather than personal behaviour alone.

    At this stage, I was still thinking in terms of awareness and communication. However, the brief’s emphasis on investigating, cataloguing, translating, and iterating suggested that the project would need to move beyond messaging. I began to consider how graphic design might actively reorganise context rather than simply reflect it.

  • Unit 1: Methods of Iterating / week 003

    Fri, Jan 30

    Movement and Time

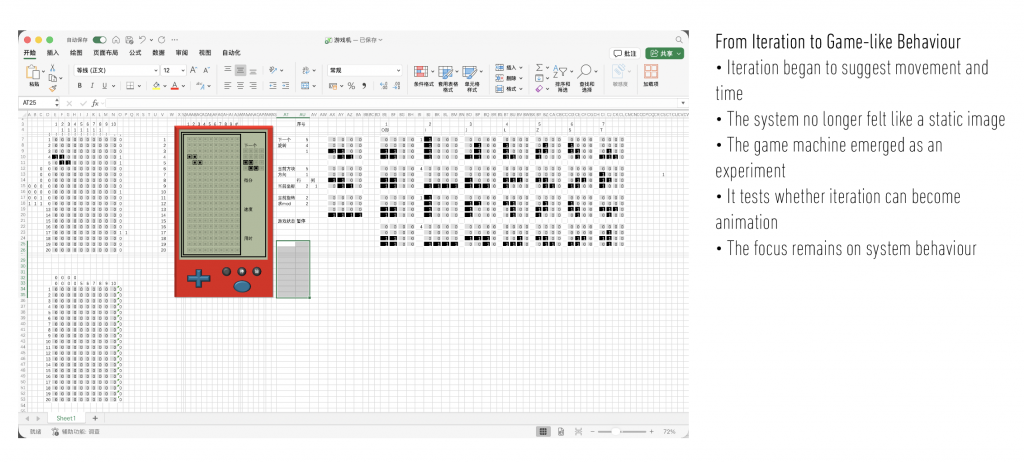
    As iterations continued, the results began to suggest movement and temporal progression. The system no longer felt like a static image but like something unfolding over time.

    This shift led me to question whether the iterative structure could evolve into something machine-like.

    Game Machine Experiment

    The idea of creating a game machine was not part of my original plan. It emerged from observing how iteration generated evolving states.

    By experimenting with gravity-like logic and basic programming, I attempted to transform the iterative process into a simplified game structure.

    This was not about making a polished game. Instead, it was an experiment to test whether Excel could simulate dynamic behaviour when pushed beyond its conventional use.

    The game machine functions as a continuation of the iterative system rather than a final outcome.

  • Unit 1: Methods of iterating / written responseⅣ

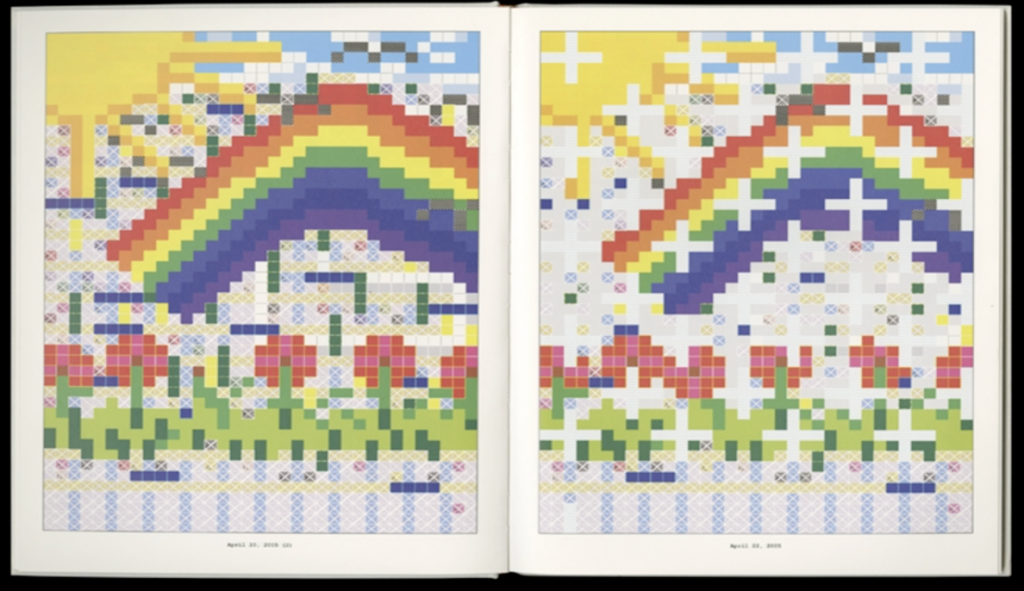
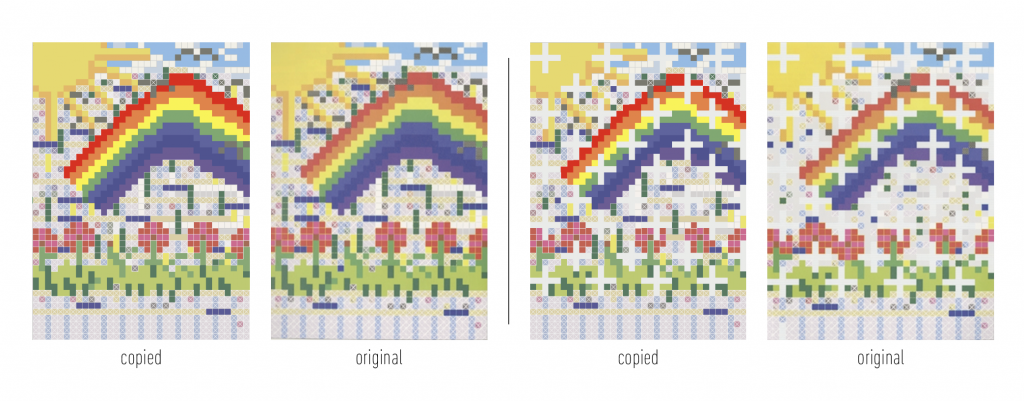
    This project began as an attempt to copy Danielle Aubert’s Excel drawings. At first, my goal was fidelity: to reproduce her composition as accurately as possible. However, during the process of copying, I became aware that Excel is not a neutral drawing tool. Its grid structure, cell dimensions, and formatting rules actively shape visual outcomes.

    Small adjustments often produced rigid, stepped forms and uneven color distributions. Rather than increasing control, repetition revealed constraint. This experience led me to question the relationship between designer and system. Is the designer controlling the tool, or is the tool structuring the designer’s possibilities?

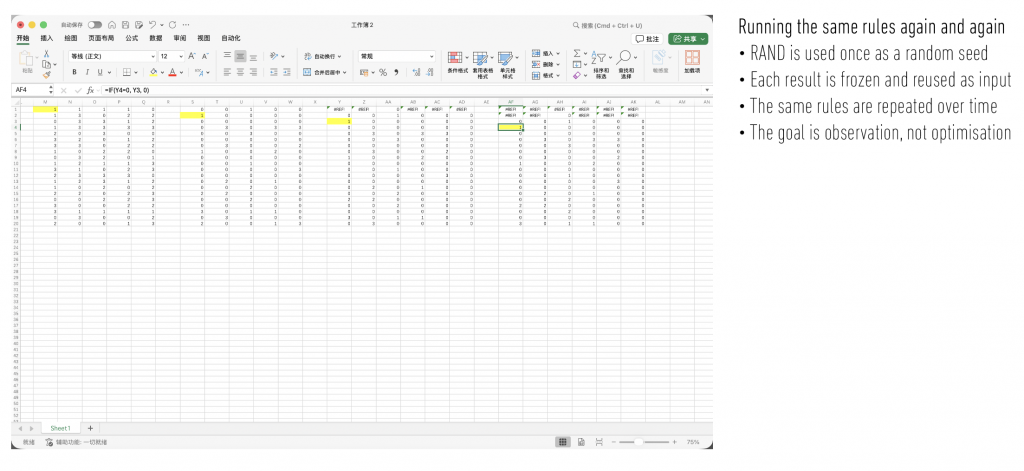
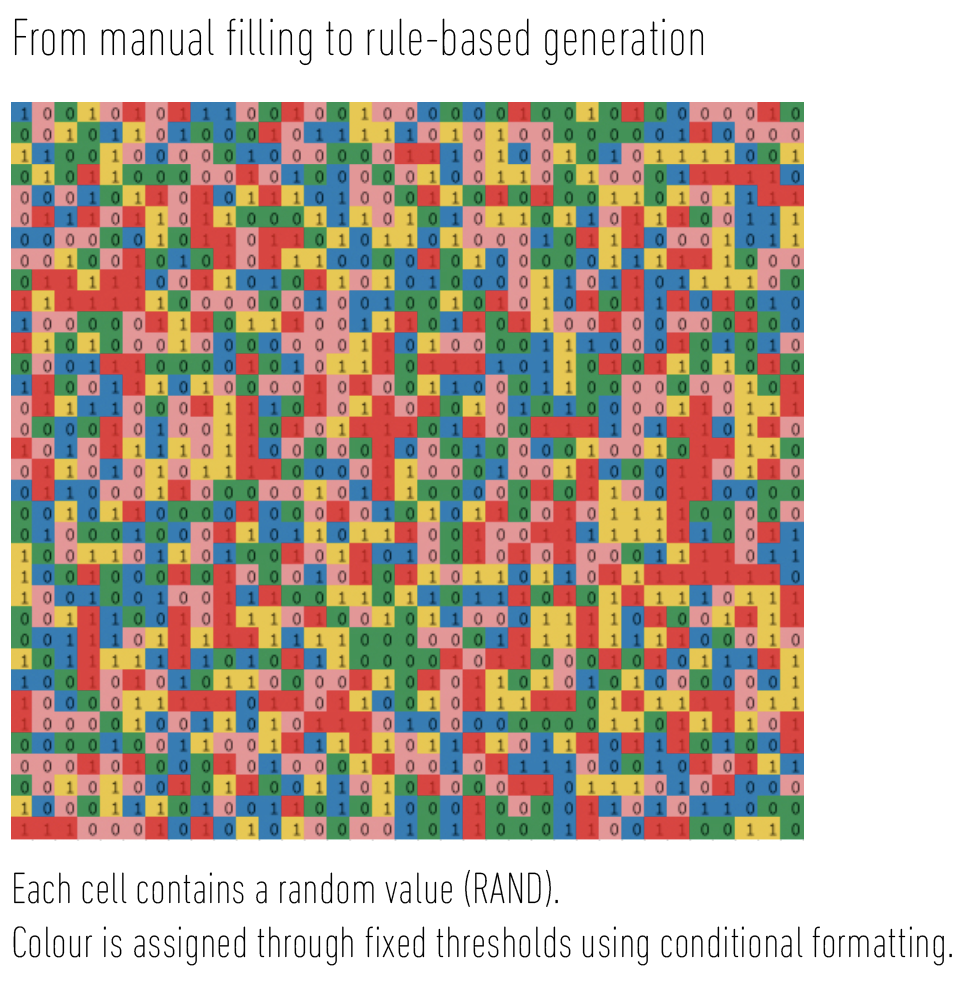
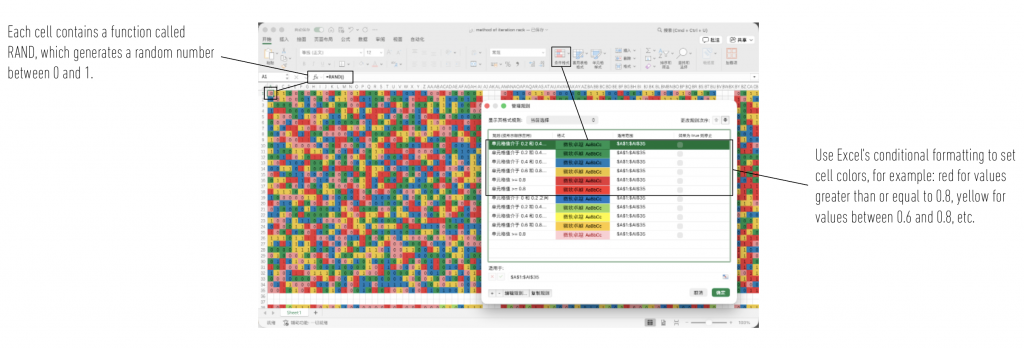
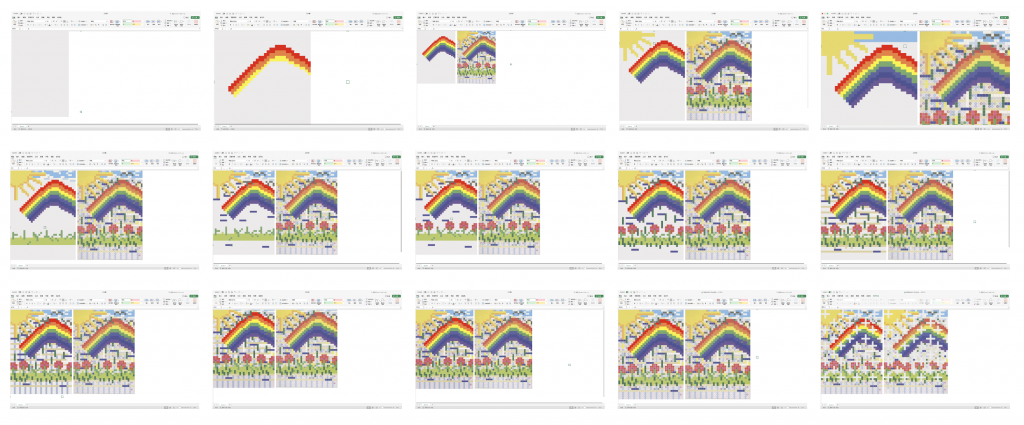
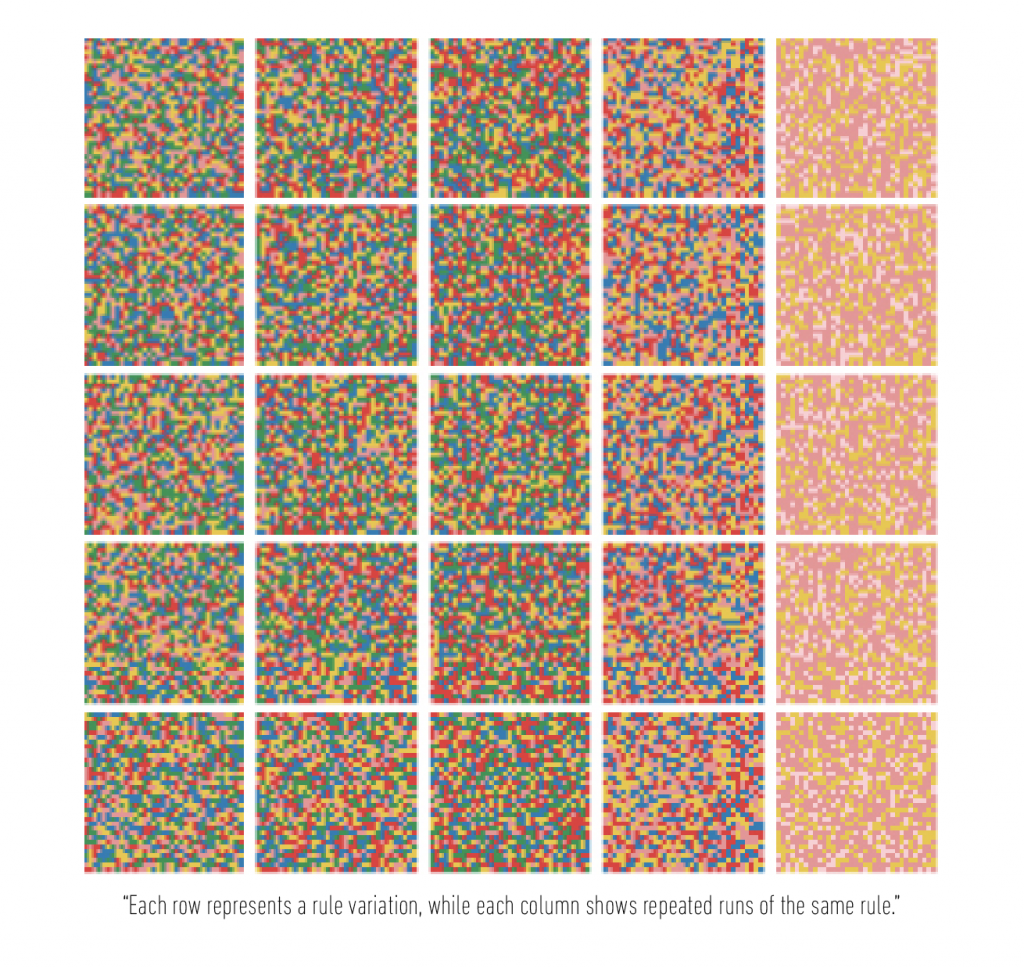
    Influenced by the Conditional Design Workbook, I shifted toward a rule-based approach. Instead of manually composing images, I defined conditions using the RAND() function and conditional formatting. Each cell generated a random value, which was translated into color through fixed thresholds. Once established, the rules operated autonomously. Each result was frozen and fed into the next iteration.

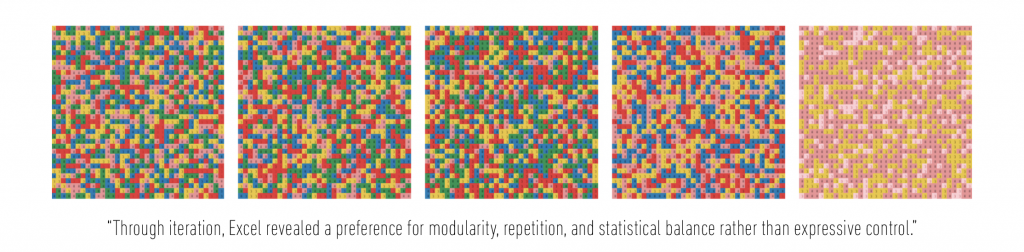
    The purpose of repetition was not refinement but observation. By running the same logic multiple times, Excel began to reveal its internal tendencies: modular distribution, statistical balance, and a resistance to fluid continuity. Over time, the sequence of iterations produced traces of movement. The system appeared less like a static image and more like an unfolding process.

    The concept of a game machine emerged from this iterative structure. It was not part of the initial plan but developed as an experiment to test whether repetition could simulate dynamic behavior. By learning basic programming techniques, I extended the logic into an interactive form. The game does not represent a final product but a continuation of the system’s evolution.

    Ultimately, this project reframes Excel as an active system rather than a passive tool. Iteration becomes a method of critical inquiry, where the process itself produces knowledge. The outcome is not a singular image, but an understanding of how structure, repetition, and constraint shape visual and temporal experience.

    References:

    Blauvelt, A., Maurer, L., Paulus, E., Puckey, J. and Wouters, R. (2013) Conditional Design Workbook. Amsterdam: Valiz.

    McLuhan, M. and Fiore, Q. (1967) The Medium is the Massage: An Inventory of Effects. Berkeley: Gingko Press.

  • Unit 1: Methods of Iterating / week 004

    Fri, Feb 6

    Final Reflection

    This project reframes Excel as an active system rather than a passive tool.

    Through copying, iteration, and emergent experimentation, I moved from image reproduction to behavioural observation.

    The final outcome is not a single image or a finished game, but a process. Iteration revealed how structure, repetition, and constraint shape both visual and temporal experience.

    By allowing the system to operate autonomously, I was able to observe Excel’s internal logic and biases.

    The process itself became the main result of the project.

  • Unit 1: Methods of iterating / week002

    Fri, Jan 23

    From Drawing to Rules

    After completing the copy, I shifted from manual composition to rule-based experimentation. Instead of adjusting visuals directly, I introduced the RAND() function to generate random values between 0 and 1 in each cell.

    Randomness was only used once as a seed. Each result was frozen and then reused as the input for the next iteration.

    Repetition and Observation

    The purpose of repetition was not refinement but observation. By applying the same rule repeatedly, I could observe how the system behaves over time.

    Through multiple iterations, Excel began to reveal its own tendencies:

    • Stable distributions
    • Modular repetition
    • Resistance to smooth transitions
    • Unpredictable yet balanced outputs

    Influenced by the Conditional Design Workbook, I began to understand design not as producing fixed forms, but as constructing conditions under which forms emerge.

    Iteration became a method of enquiry rather than improvement.

  • Unit 1: Methods of Iterating /week 001

    Fri, Jan 16

    Introduction

    For this project, I chose Microsoft Excel as my main tool. I was interested in exploring how a software typically used for data organisation could function as a visual medium. I began by copying Danielle Aubert’s Excel drawings as faithfully as possible.

    Copying Process

    The purpose of copying was not simply reproduction, but analysis. By reconstructing the image cell by cell, I began to understand how Excel’s grid structure actively shapes visual form. The fixed dimensions of cells, the limited color logic, and the alignment rules constantly influenced my decisions.

    Attempts to refine the image often resulted in stepped edges and rigid pixel-like transitions. Rather than gaining more control, I became aware of the structural limitations embedded within the tool.

    Reflection

    Through copying, I realised that Excel is not a neutral drawing surface. It enforces modularity, repetition, and discrete segmentation. These constraints became the starting point for further experimentation.